Trailer Mounted Pump Performance Curves: A Technical Guide
A pump nameplate lists a maximum flow rate and a maximum head, but a pump can never deliver both numbers at the same time. Understanding why — and knowing how to read the performance curve that actually governs sizing — is the difference between a trailer mounted water pump that matches a project’s real operating conditions and one that quietly underperforms on site.
On This Page
- Why the Performance Curve Matters More Than the Nameplate Numbers
- Anatomy of a Pump Curve
- Finding Your Operating Point
- Common Sizing Mistakes
- Reading the Curve for Trailer Mounted Pump Applications
- Practical Example / Worked Calculation
- Why Curve-Based Sizing Beats Catalog Matching
- Frequently Asked Questions
Why the Performance Curve Matters More Than the Nameplate Numbers
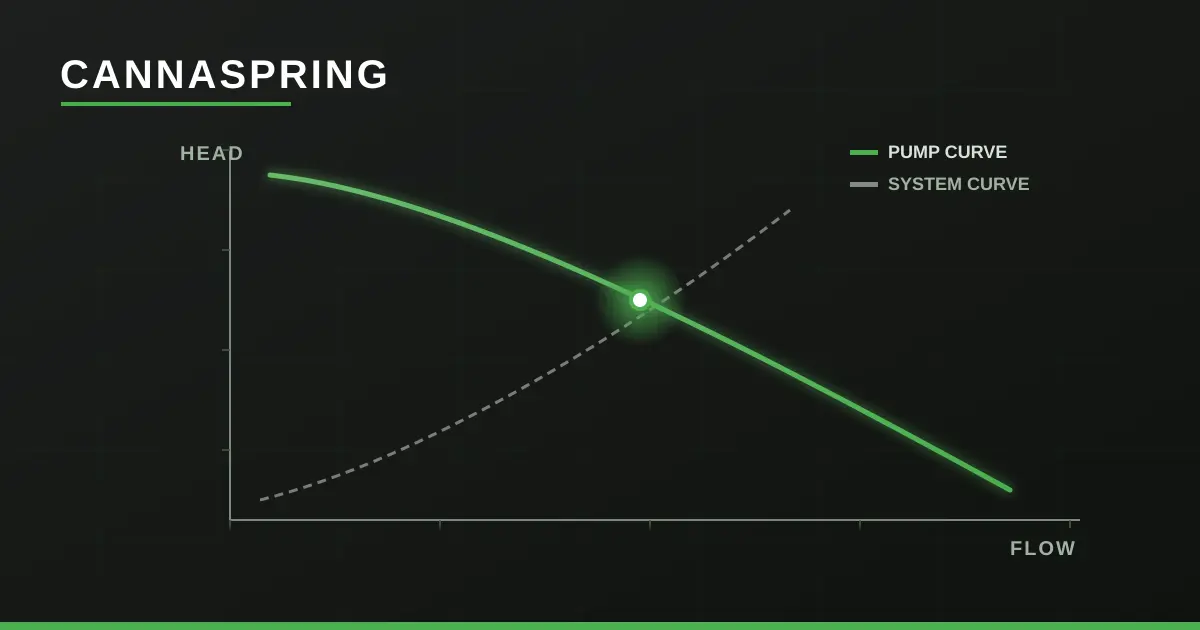
Take a spec sheet that lists a flow range of 250–600 m³/h and a head range of 0–13 m. Read in isolation, those numbers invite an assumption that the pump delivers “up to 600 m³/h” and “up to 13 m of head” as two independent capabilities. It does neither. What the spec sheet is actually describing is the two ends of a single continuous curve: at close to zero head (open discharge, minimal resistance), the pump moves close to its maximum flow; at its maximum head (the shutoff head, where the discharge is essentially blocked), flow drops to near zero. Every other combination of flow and head lies somewhere along that curve in between.
This is why two projects can specify the “same” trailer mounted pump off a catalog sheet and get very different real-world results. A project with 13 meters of static lift and a long, narrow discharge line will operate near the low-flow end of that curve — nowhere close to the advertised 600 m³/h. A project with a short, wide, low-resistance discharge will operate much closer to the high-flow end. The nameplate numbers describe the envelope; the curve describes what the pump will actually do at the head your specific site demands.
Anatomy of a Pump Curve
A complete pump performance curve sheet typically layers four separate curves over the same flow (Q) axis:
Flow vs. Head (Q-H) curve. The primary curve. For a standard centrifugal or self-priming pump, head decreases as flow increases — the pump produces its highest head at zero flow (shutoff) and its highest flow at zero head (fully open discharge, no lift).
Efficiency curve. Efficiency rises from near zero at shutoff, peaks at a specific flow point known as the Best Efficiency Point (BEP), and falls off again at higher flows. Operating consistently far to the left or right of the BEP wastes fuel or electricity and accelerates wear — running well below BEP flow for extended periods is a common and avoidable cause of premature bearing and seal wear.
NPSH required (NPSHr) curve. This rises as flow increases, representing the minimum suction-side pressure margin the pump needs at that flow to avoid cavitation. It must be compared against NPSH available (NPSHa) — a property of the site’s suction conditions, not the pump — at every point being considered.
Power (BHP) curve. How brake horsepower demand changes across the flow range — and this is where pump type matters more than most spec sheets make obvious. For a standard radial-flow centrifugal pump, power typically increases with flow, meaning the driver (engine or motor) needs to be sized for the pump’s highest expected flow condition, not its shutoff condition. For a mixed-flow or axial-flow pump — the type used in many high-volume trailer-mounted flood and bypass units — this relationship is frequently reversed: power peaks near shutoff and decreases as flow increases, an “overloading at low flow” characteristic that has real implications for how the driver is sized and how the unit is throttled during startup.
Finding Your Operating Point
The pump curve only tells half the story. The other half is the system curve — the head your specific piping arrangement demands at each flow rate, made up of static head (the vertical lift from water surface to discharge point, which doesn’t change with flow) plus friction losses (which increase roughly with the square of flow, since resistance in pipe and hose rises sharply as velocity increases).
Plot the system curve on the same axes as the pump curve, and the point where the two lines cross is the actual operating point — the flow and head the pump will genuinely produce on that specific site, as opposed to any single number pulled off the nameplate. This is also why the “rated flow” figure on a spec sheet is frequently measured at a low test head and rarely matches field performance once real static lift and hose friction are added into the system curve.
Common Sizing Mistakes
Sizing off maximum flow alone. Picking a unit because its nameplate shows the highest flow number, without checking what flow it actually delivers at the project’s required head, is the single most common sizing error. A pump rated for 180 m³/h at 14 m of head will not deliver anywhere near 180 m³/h if the actual job requires 35 m of head — a different model on the same product line, rated for a lower peak flow but a higher head range, may be the correct choice once the real operating point is checked against the curve.
Ignoring NPSH available vs. required. If NPSH available at the site — governed by suction lift, hose diameter, atmospheric pressure, and water temperature — falls below NPSH required at the intended operating flow, the pump will cavitate: noisy operation, vibration, and accelerated impeller erosion, often misdiagnosed as a mechanical defect rather than a suction-condition mismatch that curve-checking would have caught before mobilization.
Miscalculating parallel pump operation. Running two pumps in parallel does not double the flow at a given head — parallel curves add flow horizontally at each head value, but because the system curve’s resistance rises with flow, the combined operating point typically delivers noticeably less than twice the single-pump flow. Assuming a simple doubling is a common and costly overestimate on multi-pump bypass and flood response jobs.
Reading the Curve for Trailer Mounted Pump Applications
Diesel-driven units add a variable that fixed-speed electric pumps don’t have to account for: engine RPM is often adjustable within a working range, and the pump curve shifts as a family of curves across that range rather than sitting at one fixed line. This follows the pump affinity laws — flow scales roughly in direct proportion to speed, head scales with the square of speed, and power scales with the cube of speed. A diesel trailer pump rated across a speed band of, for example, 730–980 RPM doesn’t have a single curve — it has a curve for every speed setting in that range, and reading the correct one for the engine’s actual throttle position matters more than reading the top-of-range number printed largest on the spec sheet.
Self-priming configurations add one more wrinkle that the standard Q-H curve doesn’t capture at all: priming time. The curve describes performance once the suction line is primed and flowing; it says nothing about how long the unit takes to reach that state from a dry start, which depends on suction lift, line length, and air-handling capacity rather than anything shown on the flow-head plot. Sizing a self-priming trailer mounted pump for a job with frequent restart cycles needs this priming-time figure checked separately from the performance curve itself.
Practical Example / Worked Calculation
Scenario 1 — Municipal bypass, 200mm line, 25 m total dynamic head. A bypass job around a sewer repair has a measured static lift of 8 m and calculated friction losses (200mm line, 220 m run, standard fittings) of roughly 17 m at the target flow, giving a total dynamic head of approximately 25 m. Checking that head against a range of self-priming diesel-driven options:
The ZBCY150-180-14 can be ruled out immediately — its maximum head of 14 m is already below the job’s 25 m requirement, meaning it would sit at or near shutoff and deliver almost no flow at all in this system. The ZBCY150-180-35 covers the head requirement, but its curve at 25 m head (partway between its 0 and 35 m maximum) delivers noticeably less than its 180 m³/h nameplate figure. The ZBCY200-300-25 is the better match: its maximum head rating sits right at the job’s required 25 m TDH, meaning the pump is being asked to operate near the upper-flow portion of its curve rather than deep into its head-limited, low-flow region — the correct read is checking where 25 m falls on each candidate’s curve, not simply picking the model with the largest flow number printed on the sheet.
Scenario 2 — High-volume flood response, 12 m TDH, large-diameter discharge. A flood control deployment needs roughly 1,000 m³/h against a modest 12 m of total head — low head, high flow, which points toward a mixed-flow rather than a standard centrifugal design:
The CHWY-14’s head range tops out at 9 m — below the 12 m requirement — and its flow range sits under the 1,000 m³/h target, ruling it out on both axes. The CHWY-20 covers the head easily but is oversized on flow, meaning it would spend most of the job running well to the left of its curve’s efficient range at low throttle. The CHWY-16 lines up on both requirements simultaneously: 12 m of head sits comfortably within its 0–20 m range, and 1,000 m³/h sits at the low end of its 1,000–2,300 m³/h range, which — following the affinity laws described earlier — corresponds to running the engine toward the lower end of its 730–980 RPM band rather than at full throttle, leaving headroom if flow demand rises during the event.
Why Curve-Based Sizing Beats Catalog Matching
Catalog matching — picking the model whose largest printed number clears the job’s requirement — treats a pump’s capability as a single figure. Curve-based sizing treats it as what it actually is: a continuous relationship between flow and head that only tells the truth about a specific project once it’s checked against that project’s real static lift, friction losses, and suction conditions. The extra step of plotting a system curve and finding the intersection point isn’t academic exercise; it’s the difference between a unit that runs at its efficient operating range for the duration of a job and one that’s technically “rated” for the task but spends the whole job running in a corner of its curve it was never meant to sit in.
Frequently Asked Questions
Why does a trailer mounted pump deliver less flow than its rated maximum on my job site?
The rated maximum flow is typically measured at or near zero head. Once your site’s actual total dynamic head — static lift plus friction losses — is factored in, the pump operates further along its curve toward lower flow. The number on the spec sheet describes one end of the curve, not the flow you’ll see at your specific head.
How do I calculate the total dynamic head for my system curve?
Add the static head (vertical distance from the water source to the discharge point) to the friction losses in the suction and discharge lines at your target flow rate, which depend on hose diameter, length, material, and fittings. Pipe friction loss tables or hose manufacturer charts are the standard reference for this calculation.
Does running two trailer mounted pumps in parallel double my flow rate?
No. Parallel operation adds flow at a given head, but because the system curve’s resistance rises with flow, the combined operating point typically lands well below double the single-pump flow. The actual gain needs to be read from where the combined pump curve crosses the system curve, not assumed as a simple 2x multiplier.
Why does engine RPM matter for reading a diesel trailer pump’s curve?
A diesel-driven pump’s flow, head, and power all change with engine speed according to the pump affinity laws — flow scales with RPM, head with RPM squared, and power with RPM cubed. A spec sheet showing a speed range describes a family of curves, not one fixed curve, and the correct curve to reference depends on the engine’s actual throttle setting during operation.
What happens if NPSH available is lower than NPSH required at my operating point?
The pump cavitates — vapor bubbles form and collapse inside the casing, causing noise, vibration, and progressive erosion of the impeller and casing surfaces. This is a suction-condition problem, not a defect in the pump, and it’s preventable by checking NPSH available against the pump’s NPSH required curve at the intended flow before the unit is mobilized.
If your project’s flow and head requirements don’t line up cleanly with a single catalog listing, it’s often faster to work through the actual system curve than to guess between two nearby models. Contact the CannaSpring engineering support team with your target flow rate, total dynamic head, and suction conditions, and we can help match them against the right pump curve rather than the nearest number on a spec sheet.